The Acceleration of U.S. Climate-Linked Economic Burden (1890–2040 Projection)
2Independent Physicist, Membrane Institute, USA
This paper estimates the long-run evolution of U.S. climate-related economic burdens and finds strong evidence of nonlinear acceleration. Using a reconstructed baseline in the late 19th century and an integrated 2025 estimate of approximately $1.5 trillion annually in climate-attributable economic losses, we estimate that the effective doubling time of climate-related economic burden has compressed from ~115 years (circa 1890) to ~8 years in the present regime. We project forward under continued compression dynamics to 2030 and 2040, showing that costs may enter multi-trillion-dollar annual regimes within the next two decades if current nonlinear amplification persists.
1. Economic Burden Definition
The total climate-linked economic burden is defined as:
- Direct disaster losses (NOAA billion-dollar events)
- Insurance premium inflation and coverage withdrawal
- Climate-linked health costs
- Food and utility price inflation
- Productivity losses
- Federal and state disaster response expenditures
2. Anchor Points
1890 baseline (reconstructed low-coupling system): $0.2 billion
2025 integrated estimate: $1.5 trillion
Total growth factor:
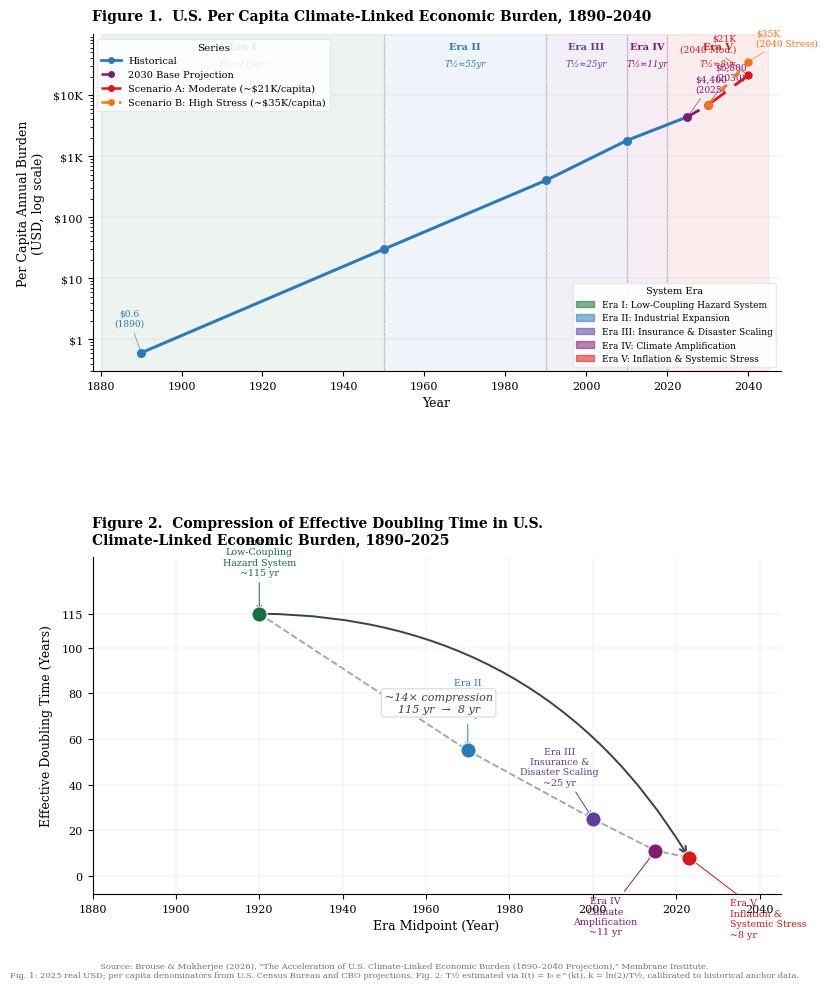
3. Historical Doubling-Time Compression
| Era | System Character | Doubling Time |
|---|---|---|
| 1890–1950 | Low coupling hazard system | ~110–120 years |
| 1950–1990 | Industrial expansion exposure | ~50–60 years |
| 1990–2010 | Insurance + disaster scaling | ~20–30 years |
| 2010–2020 | Climate amplification regime | ~10–12 years |
| 2020–2025 | Inflation + systemic stress | ~6–9 years |
Total compression: ~14× reduction in doubling time (115 → ~8 years)
4. Present Growth Rate
k = ln(2)/8 ≈ 0.0866
5. Forward Projection Method
We assume continued compression with slowing rate:
- 2025: ~8 years
- 2030: ~6 years
- 2040: ~5 years (stress scenario)
6. 2030 Projection
Per capita (2030): ≈ $6,800
7. 2040 Projections
Scenario A: Moderate Compression
I_2040 ≈ 1.5 × 2^(2.31) ≈ 7.4 trillion USD
Per capita: ≈ $21,000
Scenario B: High Nonlinear Amplification
I_2040 = 1.5 × 2^3 = 12 trillion USD
Per capita: ≈ $35,000
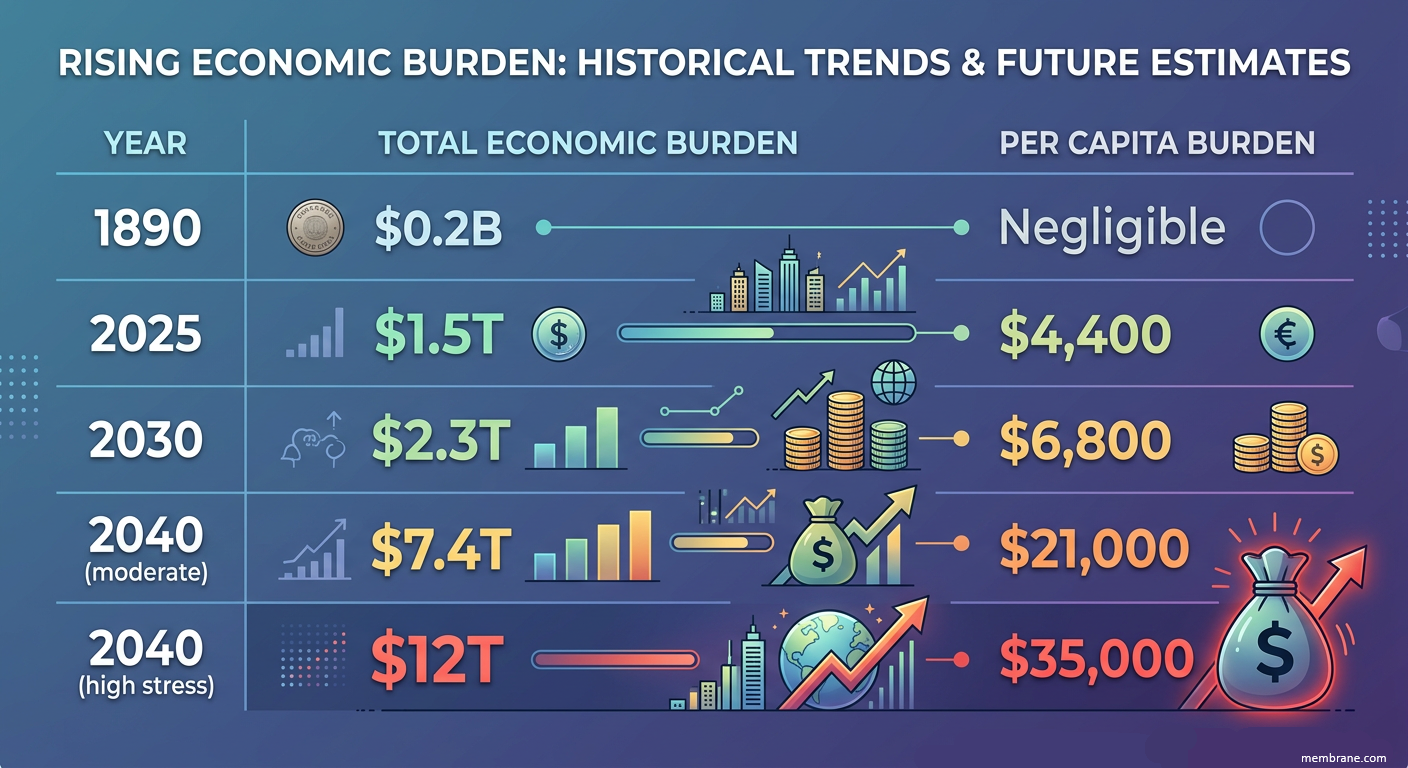
8. Summary Table
| Year | Total Economic Burden | Per Capita |
|---|---|---|
| 1890 | $0.2B | Negligible |
| 2025 | $1.5T | $4,400 |
| 2030 | $2.3T | $6,800 |
| 2040 (moderate) | $7.4T | $21,000 |
| 2040 (high stress) | $12T | $35,000 |
9. Key Finding
Climate-linked economic burden in the United States exhibits a nonlinear acceleration regime characterized by a ~14× compression in doubling times since 1890, shifting from century-scale dynamics to decade-scale systemic amplification.
10. Conclusion
The United States climate-linked economic burden has transitioned from a low-coupling hazard system in the late 19th century to a highly nonlinear, inflation-amplified economic stress system in the 21st century. Using a 2025 estimate of $1.5 trillion annually, we find that doubling times have compressed from ~115 years to ~8 years, implying a ~14× acceleration in the growth rate of climate-attributable damages. Under continued compression, annual burdens may reach $7–12 trillion by 2040.
Also see:
Climate Welfare Accounting Framework (CWAF): The Welfare Cost of Climate Change in the United States
* Our probabilistic, ensemble-based climate model — which incorporates complex socio-economic and ecological feedback loops within a dynamic, nonlinear system — projects that global temperatures are becoming unsustainable this century. This far exceeds earlier estimates of a 4°C rise over the next thousand years, highlighting a dramatic acceleration in global warming. We are now entering a phase of compound, cascading collapse, where climate, ecological, and societal systems destabilize through interlinked, self-reinforcing feedback loops.
We examine how human activities — such as deforestation, fossil fuel combustion, mass consumption, industrial agriculture, and land development — interact with ecological processes like thermal energy redistribution, carbon cycling, hydrological flow, biodiversity loss, and the spread of disease vectors. These interactions do not follow linear cause-and-effect patterns. Instead, they form complex, self-reinforcing feedback loops that can trigger rapid, system-wide transformations — often abruptly and without warning. Grasping these dynamics is crucial for accurately assessing global risks and developing effective strategies for long-term survival.
Feedback Loops → Tipping Points → Acceleration → Domino Effect
Feedback loops amplify climate change and can push interconnected Earth systems past critical tipping points. As tipping points are crossed, they can trigger additional feedback loops and destabilize other climate systems. This cascading "Domino Effect" compresses timescales, accelerates change, and increases the risk of rapid, nonlinear climate transformations.Sources
Primary Research Papers (Brouse & Mukherjee framework)
-
The 2025 Cost of Climate Change in the United States
— Brouse and Mukherjee (June 2026) -
Case Study: Climate Coupling and Hidden Economic Costs
— Brouse (March 2026) -
Climate-Driven Range Shifts and the Nonlinear Acceleration of Ecosystem Destabilization
— Brouse and Mukherjee (May 2026) -
Climate Displacement and Nonlinear Acceleration: When Extreme Weather Becomes a Systemic Driver of Human Mobility
— Brouse and Mukherjee (June 2026) -
Emergent Climate Dynamics: The Nonlinear Acceleration of Climate Impacts (working paper / framework synthesis referenced across series)
— Brouse and Mukherjee (2026) -
A Unified Energetics Framework for Climate-Linked Economic Disruption (March 2026)
— Brouse (2026) -
Runaway Climate Feedbacks and Systemic Collapse: Integrated Economic and Physical Risk Pathways (2025)
— Brouse (2025) -
Climate-Driven Health Collapse: Macroeconomic Impacts of Heat, Disease, and Productivity Loss (2025)
— Brouse (2025) -
The Race Against Time: Climate Acceleration Under Political and Economic Stressors (2025)
— Brouse (2025)
External Scientific and Institutional References
- NOAA — Billion-Dollar Weather and Climate Disasters
- Climate Central — Climate Disasters and Loss Accounting
- IPCC AR6 Reports (2021–2023)
- WMO — State of the Global Climate Reports
- NASA Earth Science Division — Climate Change Evidence
- U.S. National Climate Assessment (USGCRP)
- Swiss Re Institute — Climate Risk Economics
- Munich Re NatCatSERVICE — Disaster Loss Database