Observational Evidence of Climate Jerk
Daniel Brouse¹ and Sidd Mukherjee²
June 2026
¹Independent Climate Researcher, Economist
²Physicist
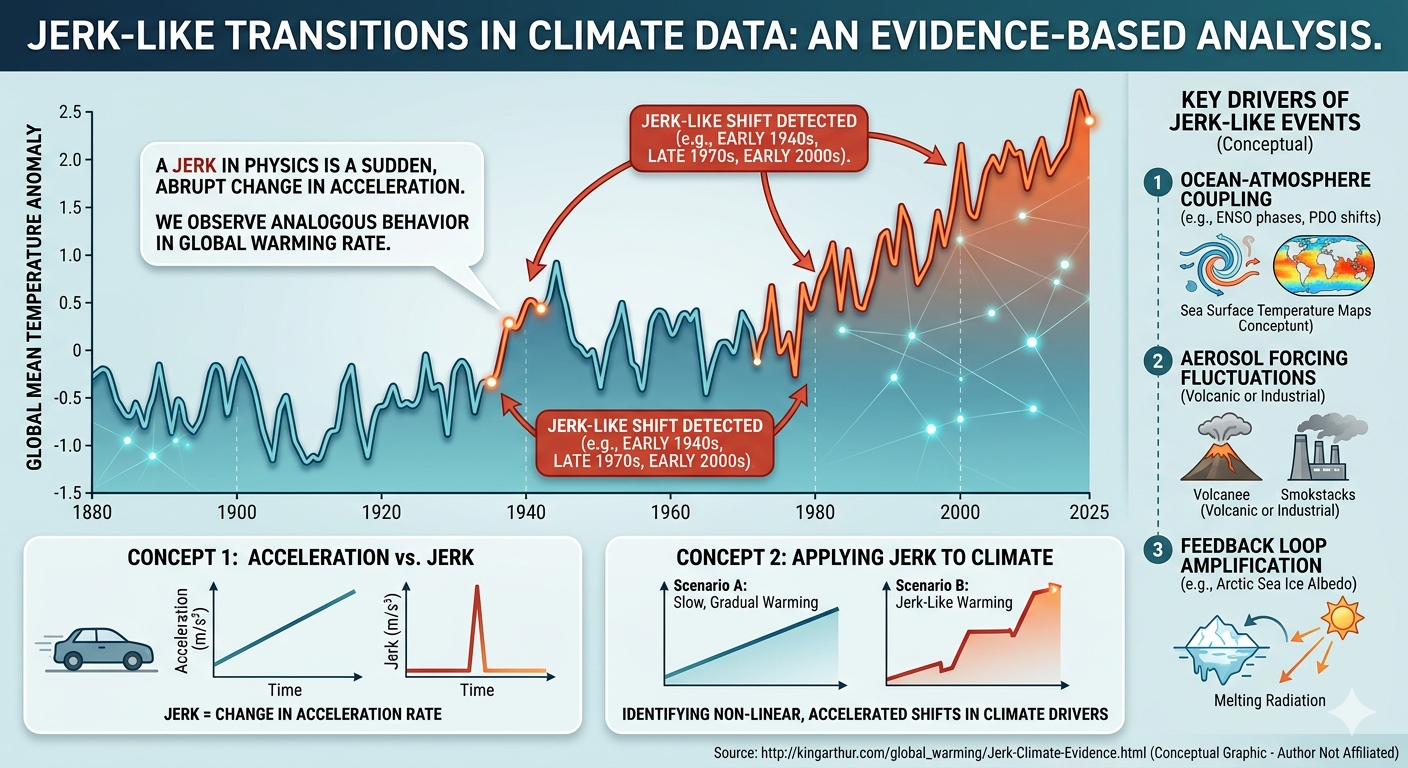
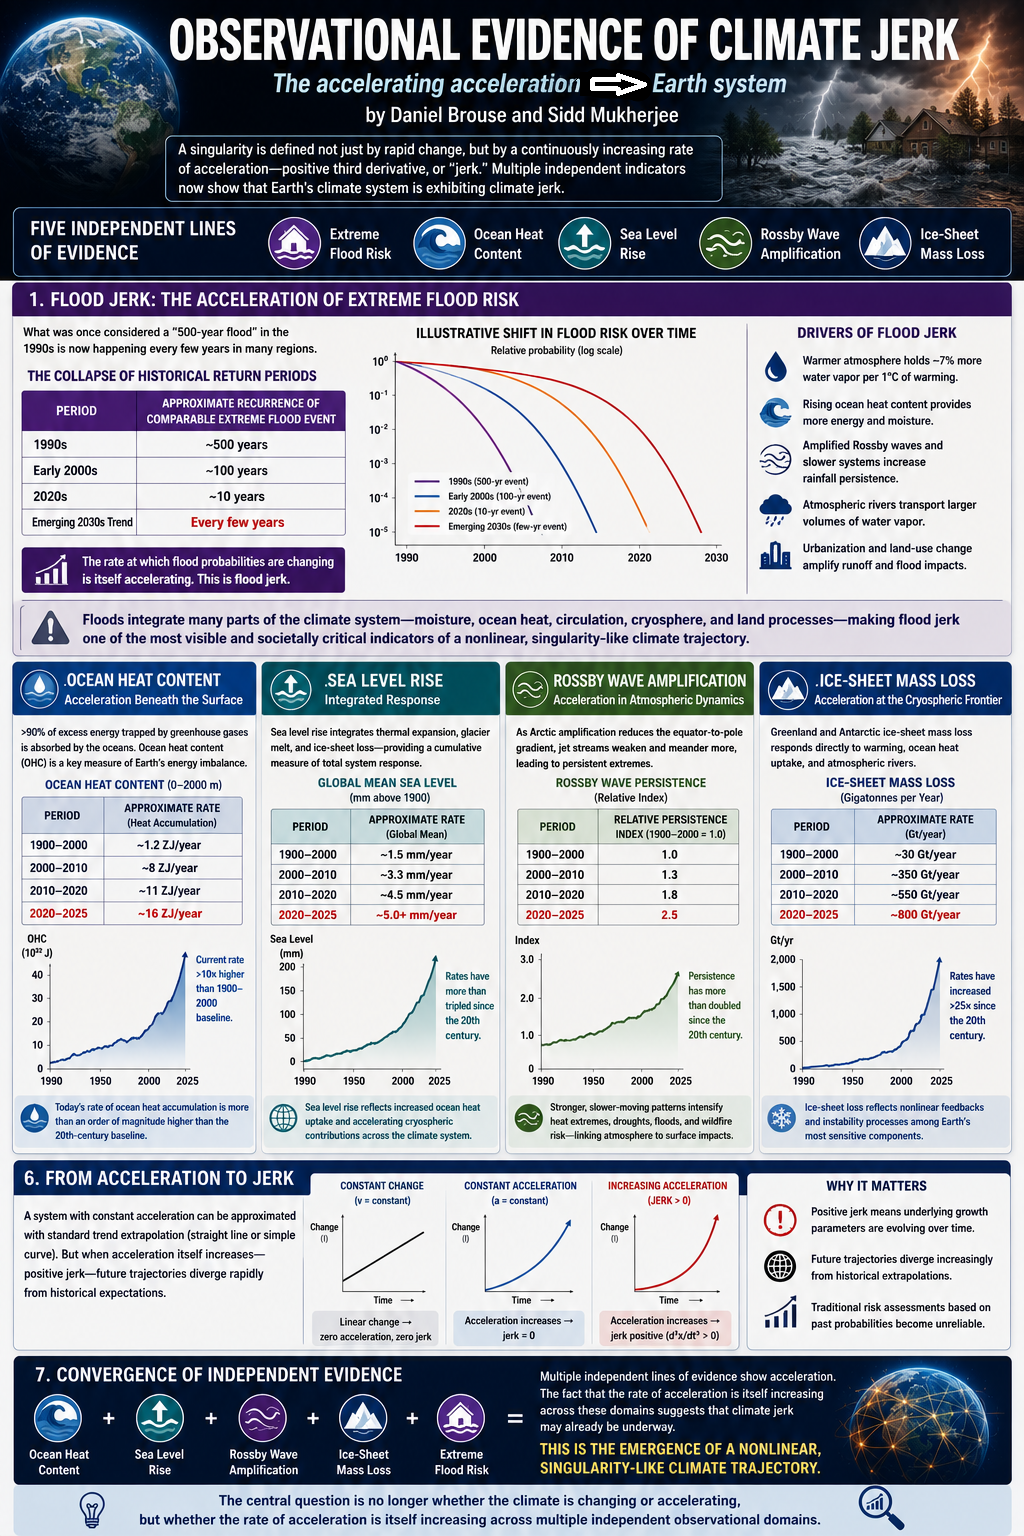
The defining characteristic of a singularity is not merely rapid change, but a continuously increasing rate of acceleration. In mathematical terms, the system exhibits a positive third derivative—commonly referred to as "jerk." While global surface temperature remains the most widely cited climate metric, several other indicators provide clearer evidence that the Earth system is increasingly characterized not simply by change or acceleration, but by acceleration of acceleration.
Among the strongest candidates are extreme flood risk, ocean heat content, sea level rise, Rossby wave amplification, and ice-sheet mass loss. Together, these indicators span the atmosphere, hydrosphere, cryosphere, and oceans, providing multiple independent lines of observational evidence that the climate system is entering an increasingly nonlinear regime.
Flood Jerk: The Acceleration of Extreme Flood Risk
One of the clearest examples of climate jerk—the acceleration of acceleration—can be observed in the changing frequency of extreme flood events.
In the 1990s, what was considered a “500-year flood” was expected to occur, on average, once every five centuries. Such events represented the extreme tail of the hydrological distribution and were considered exceptionally rare. By the early 2000s, however, many flood events of comparable magnitude were being reclassified as 100-year floods as historical precipitation records and flood-frequency analyses were updated.
The trend did not stop there.
By the 2020s, floods once considered 100-year events increasingly resembled 10-year events. In some regions, comparable rainfall and flooding episodes are now occurring every few years. What was once considered an extraordinary outlier has become part of the emerging climatological baseline.
This progression represents far more than a simple increase in flood frequency. It suggests that the rate at which flood probabilities are changing is itself accelerating.
From Flood Acceleration to Flood Jerk

Traditional climate assessments often focus on changes in average precipitation. However, flooding is driven disproportionately by extreme rainfall events, atmospheric river activity, storm persistence, and moisture availability in the atmosphere.
Several physical mechanisms contribute to this accelerating trend:
-
A warmer atmosphere holds approximately 7% more water vapor for every 1°C of warming.
-
Ocean heat content continues to increase, providing additional energy and moisture to storm systems.
-
Amplified Rossby waves and slower-moving weather patterns increase rainfall persistence.
-
Atmospheric rivers transport larger volumes of water vapor over longer durations.
-
Urbanization and land-use changes can further amplify runoff and flood impacts.
Together, these factors create a nonlinear response in flood risk. Rainfall extremes increase, storm duration increases, and the geographic footprint of extreme precipitation expands. The result is a compounding increase in both flood frequency and flood magnitude.
The Collapse of Historical Return Periods
Flood-frequency statistics are based on the assumption that the underlying climate remains relatively stable over time. As the climate system shifts, these assumptions begin to break down.
A simplified illustration is shown below:
| Period | Approximate Recurrence of Comparable Extreme Flood Event |
|---|---|
| 1990s | ~500 years |
| Early 2000s | ~100 years |
| 2020s | ~10 years |
| Emerging 2030s Trend | Every few years |
The exact values vary by region, but the direction of change is remarkably consistent across many observational records. Events once considered statistically extraordinary are becoming increasingly common.
Flood Jerk as a Singularity Indicator
The significance of flood jerk extends beyond hydrology. Floods integrate multiple components of the climate system, including atmospheric moisture, ocean heat content, storm dynamics, and large-scale circulation patterns.
As a result, accelerating flood frequency serves as a visible manifestation of deeper systemic changes occurring throughout the Earth system.
The critical observation is not simply that floods are becoming more common. It is that the rate at which flood probabilities are changing appears to be increasing. In mathematical terms, the flood system exhibits positive jerk.
This distinction matters because societies, infrastructure, insurance systems, and economic planning are generally designed around historical probabilities. When those probabilities themselves begin changing at an accelerating rate, risk assessments based on the past become increasingly unreliable.
Flood jerk therefore provides one of the most tangible and societally relevant examples of a climate system transitioning from gradual change toward nonlinear, singularity-like behavior.
Ocean Heat Content: Acceleration Beneath the Surface
More than 90% of the excess energy trapped by greenhouse gases is absorbed by the oceans. As a result, ocean heat content (OHC) provides one of the most reliable measures of Earth’s energy imbalance.
Estimated rates of heat accumulation have increased significantly:
| Period | Approximate Rate |
|---|---|
| 1900–2000 | ~1.2 ZJ/year |
| 2000–2010 | ~8 ZJ/year |
| 2010–2020 | ~11 ZJ/year |
| 2020–2025 | ~16 ZJ/year |
Relative to the 20th-century baseline, the current rate of ocean heat accumulation is more than an order of magnitude higher. This makes ocean heat content one of the clearest physical indicators of accelerating planetary energy imbalance.
Sea Level Rise: Integrated Response of the Climate System
Global mean sea level rise integrates multiple processes including thermal expansion of seawater, glacier melt, and ice-sheet mass loss. As such, it functions as a cumulative indicator of total system response to energy imbalance.
Estimated rates of sea level rise have increased over time:
| Period | Approximate Rate |
|---|---|
| 1900–2000 | ~1.5 mm/year |
| 2000–2010 | ~3.3 mm/year |
| 2010–2020 | ~4.5 mm/year |
| 2020–2025 | ~5.0+ mm/year |
The transition from relatively modest 20th-century rates to significantly higher modern rates reflects both increased ocean heat uptake and accelerating cryospheric contributions. Because sea level rise integrates multiple subsystems, it provides a key “system-level” measure of climate acceleration.
Rossby Wave Amplification: Acceleration in Atmospheric Dynamics
Rossby waves regulate the large-scale structure of atmospheric circulation. Their amplitude, persistence, and phase behavior influence heat waves, droughts, atmospheric rivers, and persistent blocking events.
As Arctic amplification reduces the equator-to-pole temperature gradient, jet stream flow weakens and becomes more susceptible to high-amplitude meanders. This contributes to increasingly persistent weather extremes.
| Period | Relative Persistence Index |
|---|---|
| 1900–2000 | 1.0 |
| 2000–2010 | 1.3 |
| 2010–2020 | 1.8 |
| 2020–2025 | 2.5 |
Rossby wave amplification is particularly important because it functions as a coupling mechanism between atmospheric dynamics and surface impacts. Persistent circulation patterns intensify heat extremes, drought persistence, flood clustering, and wildfire risk, thereby linking atmospheric behavior to surface system responses.
Ice-Sheet Mass Loss: Acceleration at the Cryospheric Frontier
Ice-sheet mass loss from Greenland and Antarctica represents one of the most direct responses to increasing radiative forcing and ocean heat uptake.
| Period | Approximate Rate |
|---|---|
| 1900–2000 | ~30 Gt/year |
| 2000–2010 | ~350 Gt/year |
| 2010–2020 | ~550 Gt/year |
| 2020–2025 | ~800 Gt/year |
The increase in ice-sheet mass loss reflects the combined effects of surface melt, ice-ocean interactions, atmospheric river intrusion, and structural instability in outlet glaciers. These interacting processes produce strong nonlinear feedback behavior and make ice sheets one of the most sensitive components of the Earth system.
From Acceleration to Jerk
Individually, extreme flood risk, ocean heat content, sea level rise, Rossby wave amplification, and ice-sheet mass loss each demonstrate clear acceleration. Taken together, they indicate something more significant: the acceleration itself is increasing.
This distinction is critical. A system with constant acceleration can often be approximated using standard trend extrapolation. A system with positive jerk cannot. In such a system, the underlying growth parameters evolve over time, and future trajectories diverge increasingly from historical expectations.
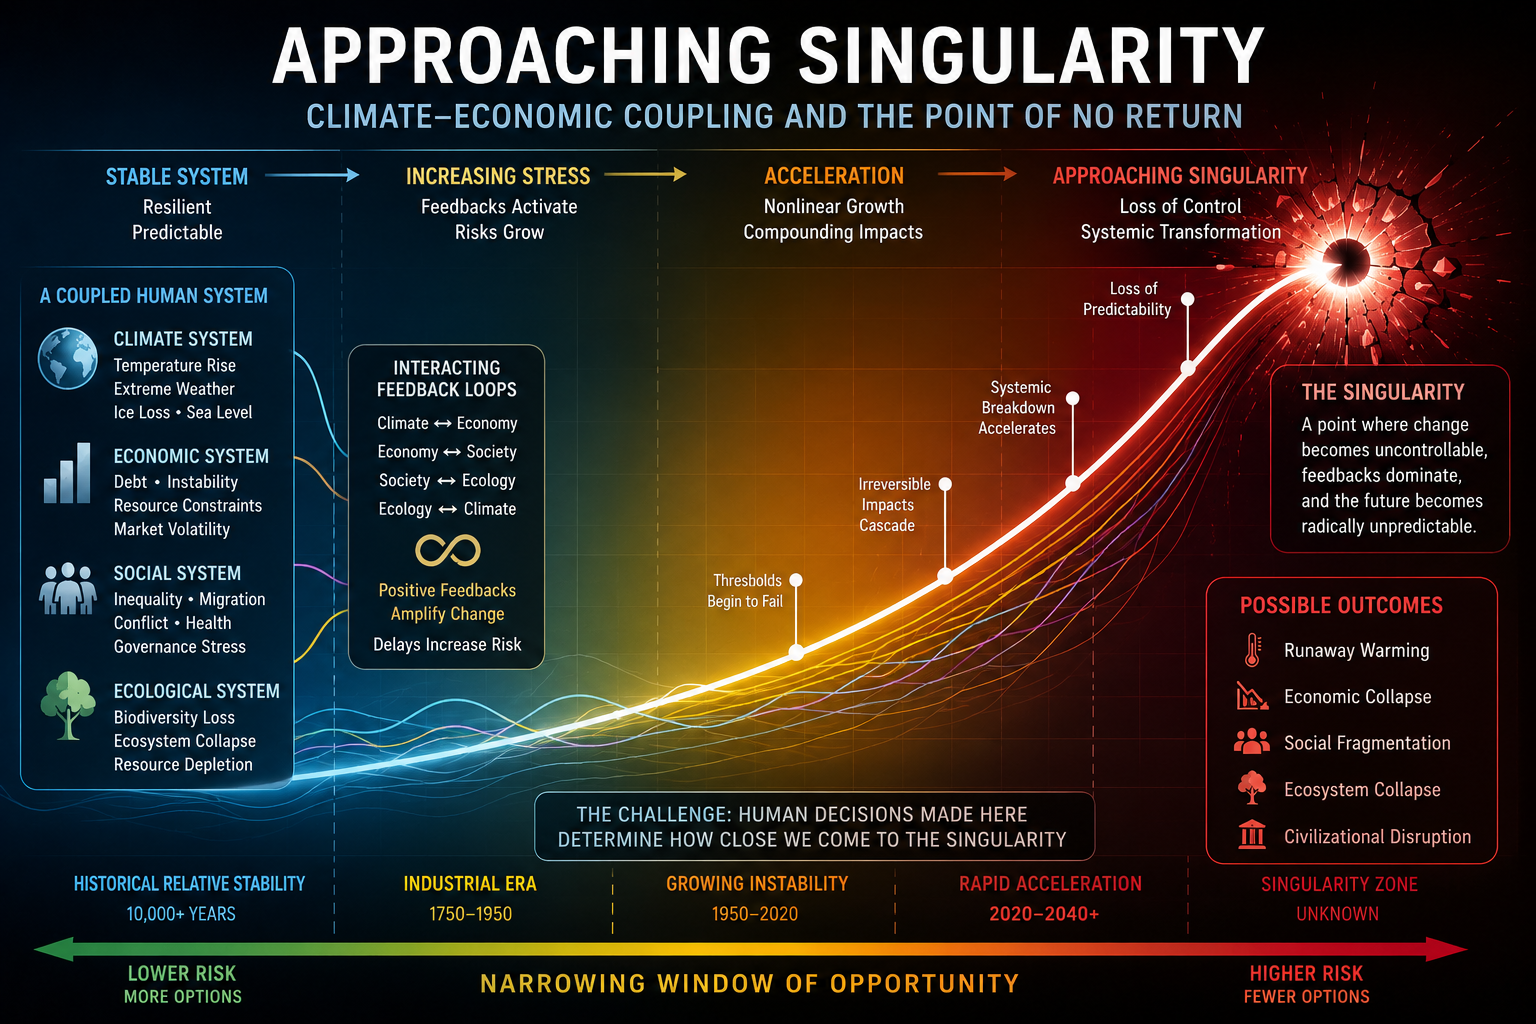
In this framework, the emergence of climate jerk represents a potential indicator that the Earth system is transitioning toward a regime dominated by nonlinear feedbacks and interacting subsystems. The central question is therefore no longer whether the climate is changing or accelerating, but whether the rate of acceleration is itself increasing across multiple independent observational domains.
The convergence of accelerating flood risk, increasing ocean heat accumulation, rising sea levels, amplified atmospheric circulation patterns, and rapidly growing ice-sheet mass loss suggests that this condition may already be underway. These indicators are particularly compelling because they arise from different components of the Earth system yet exhibit remarkably similar behavior. Each reflects not merely change, but an increasing rate of change.
Flood risk provides perhaps the most visible manifestation of this phenomenon. Communities around the world are witnessing the collapse of historical return periods as floods once classified as 500-year or 100-year events become increasingly frequent. Ocean heat content records reveal accelerating planetary energy accumulation. Sea level rise reflects the integrated response of warming oceans and melting ice. Rossby wave amplification contributes to increasingly persistent weather extremes. Ice-sheet mass loss demonstrates accelerating cryospheric instability.
Collectively, these observations suggest that the Earth system is increasingly characterized not merely by climate change, nor even by climate acceleration, but by acceleration of acceleration itself. If sustained, this pattern would imply that future climate impacts may arrive faster than expected from linear or even exponential projections, consistent with the emergence of singularity-like dynamics driven by coupled feedbacks and positive climate jerk.
- Singularity: Public Access Version (6th-grade level)
- Singularity: Easy Version (~8th–10th grade level)
- Singularity: Journal-Ready Version (~college graduate level)
Easy-to-Read References
-
Singularity: The Runaway Guitar Feedback Scenario
Definitions of: runaway climate indicator feedbacks, runaway greenhouse effect, Hothouse Earth, Venus Syndrome, and singularity - The Runaway Train Scenario
- Example: Amazon Rainforest Dieback
References
IPCC (2023). Sixth Assessment Report
Lenton, T. et al. (2019). Climate tipping points
Hansen, J. et al. (2016). Ice melt and sea level rise
NOAA National Centers for Environmental Information. Billion-Dollar Weather and Climate Disasters Database
- A Unified Energetics Framework for Accelerating Climate Change: From Radiative Forcing to Drag Physics — Brouse and Mukherjee (March 2026)
- Emergent Climate Dynamics: The Nonlinear Acceleration of Climate Impacts — Brouse and Mukherjee (March 2026)
- The Third Derivative and Climate Acceleration: Why Change Is Increasing Faster Over Time — Brouse (March 2026)
- Case Study: Climate Coupling and Hidden Economic Costs — Brouse (March 2026)
- How Not to Be a Jerk: Third Derivatives and the Singularity of Climate Change — Brouse and Mukherjee (March 2026)
* Our probabilistic, ensemble-based climate model — which incorporates complex socio-economic and ecological feedback loops within a dynamic, nonlinear system — projects that global temperatures are becoming unsustainable this century. This far exceeds earlier estimates of a 4°C rise over the next thousand years, highlighting a dramatic acceleration in global warming. We are now entering a phase of compound, cascading collapse, where climate, ecological, and societal systems destabilize through interlinked, self-reinforcing feedback loops.
Tipping points and feedback loops drive the acceleration of climate change. When one tipping point is toppled and triggers others, the cascading collapse is known as the Domino Effect.
Further References
Primary Sources
Brouse, D., & Mukherjee, S. (2026). 2026: Confirmation of Nonlinear Climate Acceleration in the Arctic–North Atlantic System. Membrane.com Climate Science Series. Retrieved from http://membrane.com/global_warming/Nonlinear-Climate-Acceleration.html
Brouse, D., & Mukherjee, S. (2026). Amazon Rainforest Dieback: Emerging Risks, Feedback Loops, and Scenario-Based Projections. Membrane.com Climate Science Series. Retrieved from http://membrane.com/global_warming/Amazon-Dieback.html
Brouse, D., & Mukherjee, S. (2026). A Unified Energetics Framework for Accelerating Climate Change: From Radiative Forcing to Drag Physics. Membrane.com Climate Science Series. Retrieved from http://membrane.com/global_warming/Climate-Change-Math-and-Physics.html
Brouse, D., & Mukherjee, S. (2026). Is Climate Change on a Runaway Train?. Membrane.com Climate Science Series. Retrieved from http://membrane.com/global_warming/Climate-Runaway-Train-Scenario.html
Hansen and Colleagues
Hansen, J. E. (2025). Runaway Climate: The Point of No Return. Climate Science, Awareness and Action Newsletter. Retrieved from https://mailchi.mp/caa/runaway-climate-the-point-of-no-return
Hansen, J. E., Kharecha, P., Morgan, P., et al. (2025). Global Warming Acceleration: Impact on Sea Ice. Retrieved from http://membrane.com/global_warming/notes/SeaIce-Acceleration-02April2025.pdf
Hansen, J. E., Kharecha, P., & Morgan, P. (2025). Warning! This "Colorful Chart" is Censored by IPCC. Retrieved from http://membrane.com/global_warming/notes/Hansen-Acceleration-2025.pdf
Peer-Reviewed Literature
Baldwin, M. P., et al. (2021). Climate system variability and atmospheric circulation changes. Reviews of Geophysics, 59(1).
Caesar, L., McCarthy, G. D., Thornalley, D. J. R., Cahill, N., & Rahmstorf, S. (2021). Current Atlantic Meridional Overturning Circulation weakest in the last millennium. Nature Geoscience, 14, 118–120.
Francis, J. A., & Vavrus, S. J. (2012). Evidence linking Arctic amplification to extreme weather in mid-latitudes. Geophysical Research Letters, 39(6).
IMBIE Team. (2020). Mass balance of the Greenland Ice Sheet from 1992–2018. Nature, 579, 233–239.
Khan, S. A., Aschwanden, A., Bjørk, A. A., et al. (2016). Greenland ice sheet mass balance and sea-level contribution. Science Advances, 2(11), e1600931.
Mann, M. E., Rahmstorf, S., Kornhuber, K., et al. (2017). Influence of anthropogenic climate change on planetary wave resonance and extreme weather events. Scientific Reports, 7, 45242.
Overland, J. E., Hanna, E., Hanssen-Bauer, I., et al. (2019). The urgency of Arctic climate change. Nature Climate Change, 9, 181–184.
Serreze, M. C., & Barry, R. G. (2011). Processes and impacts of Arctic amplification. Global and Planetary Change, 77(1–2), 85–96.
Svennevig, K., et al. (2023). Climate-driven slope failures and cryosphere destabilization in Greenland. Geophysical Research Letters, 50.
Major Assessments and Data Sources
IPCC. (2021). Climate Change 2021: The Physical Science Basis. Contribution of Working Group I to the Sixth Assessment Report. Cambridge University Press.
NASA. (2025). Global Mean Sea Level from Satellite Altimetry. National Aeronautics and Space Administration. Retrieved from https://sealevel.nasa.gov
National Oceanic and Atmospheric Administration (NOAA). (2025). Climate Indicators and Global Monitoring Data. Retrieved from https://www.noaa.gov
World Meteorological Organization (WMO). (2024). State of the Global Climate 2024. Geneva, Switzerland.
Copernicus Climate Change Service (C3S). (2025). Global Climate Highlights. European Union.
Additional Recent Literature Relevant to Nonlinear Climate Dynamics
Armstrong McKay, D. I., Staal, A., Abrams, J. F., et al. (2022). Exceeding 1.5°C global warming could trigger multiple climate tipping points. Science, 377(6611), eabn7950.
Boers, N. (2021). Observation-based early-warning signals for a collapse of the Atlantic Meridional Overturning Circulation. Nature Climate Change, 11, 680–688.
Lenton, T. M., Rockström, J., Gaffney, O., et al. (2019). Climate tipping points—too risky to bet against. Nature, 575, 592–595.
Ripple, W. J., Wolf, C., Gregg, J. W., et al. (2024). The 2024 State of the Climate Report: Perilous Times on Planet Earth. BioScience.
Steffen, W., Rockström, J., Richardson, K., et al. (2018). Trajectories of the Earth System in the Anthropocene. Proceedings of the National Academy of Sciences, 115(33), 8252–8259.
Richardson, K., Steffen, W., Lucht, W., et al. (2023). Earth beyond six of nine planetary boundaries. Science Advances, 9(37), eadh2458.