by Daniel Brouse
July 2026
Climate responsibility depends on how emissions are assigned. Traditional territorial accounting attributes emissions to the country where they occur, but globalization has made that approach increasingly incomplete. Modern supply chains, international trade, and service-based economies often separate where emissions are produced from who ultimately benefits from them.
To explore this problem from two different perspectives, I developed two complementary accounting frameworks.
The first paper, The True Climate Footprint: Measuring Per Capita Total Contribution Beyond Territorial Emissions, introduces the Per Capita Total Contribution (PCTC) framework. PCTC seeks to estimate an individual’s or nation’s complete climate responsibility by incorporating not only consumption, but also several major sources of emissions that are frequently omitted from conventional carbon accounting.
The PCTC framework includes:
The second paper, The Carbon We Own: Why Consumption Matters More, examines climate responsibility from a different perspective. Rather than estimating total climate contribution, it focuses specifically on the carbon footprint required to support modern lifestyles using a consumption-based accounting approach.
This framework emphasizes:
Unlike PCTC, this framework intentionally places less emphasis on fossil fuel extraction and producer responsibility in order to better isolate the climate impacts associated with everyday consumption.
After completing the first paper, I wanted to examine the climate footprint from the perspective of the consumer rather than the entire climate system. The PCTC framework provides a comprehensive measure of total responsibility, but it does not distinguish as clearly between emissions driven by individual lifestyle choices and those associated with resource extraction or national production.
A consumption-based framework highlights decisions that individuals and societies can influence more directly. Choices such as lowering a home’s thermostat, improving insulation, selecting public transportation or electric vehicles instead of internal combustion vehicles, reducing air travel, or purchasing fewer carbon-intensive goods become more visible within the accounting. It also better captures the increasingly important role of service-based economies. While services may appear less energy-intensive than manufacturing, sectors such as healthcare, finance, telecommunications, cloud computing, and artificial intelligence rely on extensive digital infrastructure—including energy-hungry data centers—that can be substantially underrepresented in traditional emissions inventories.
Finally, I wanted a more detailed comparison among developed economies, particularly within Europe. Countries such as Norway and France illustrate why accounting methodology matters. Norway has one of the world’s cleanest domestic electricity systems, powered primarily by hydropower, yet it is also a major exporter of oil and natural gas. France, by contrast, derives much of its electricity from nuclear power, resulting in comparatively low-carbon domestic energy while maintaining a high standard of living. Comparing these countries under both frameworks reveals how different accounting methods assign responsibility and helps illustrate the strengths and limitations of each approach.
Taken together, these two papers do not compete—they answer different questions. Per Capita Total Contribution (PCTC) asks, What is humanity’s full climate responsibility? Consumption-based accounting asks, What emissions are required to sustain the lifestyle of the average resident? Used together, they provide a more complete understanding of climate responsibility than either framework alone.
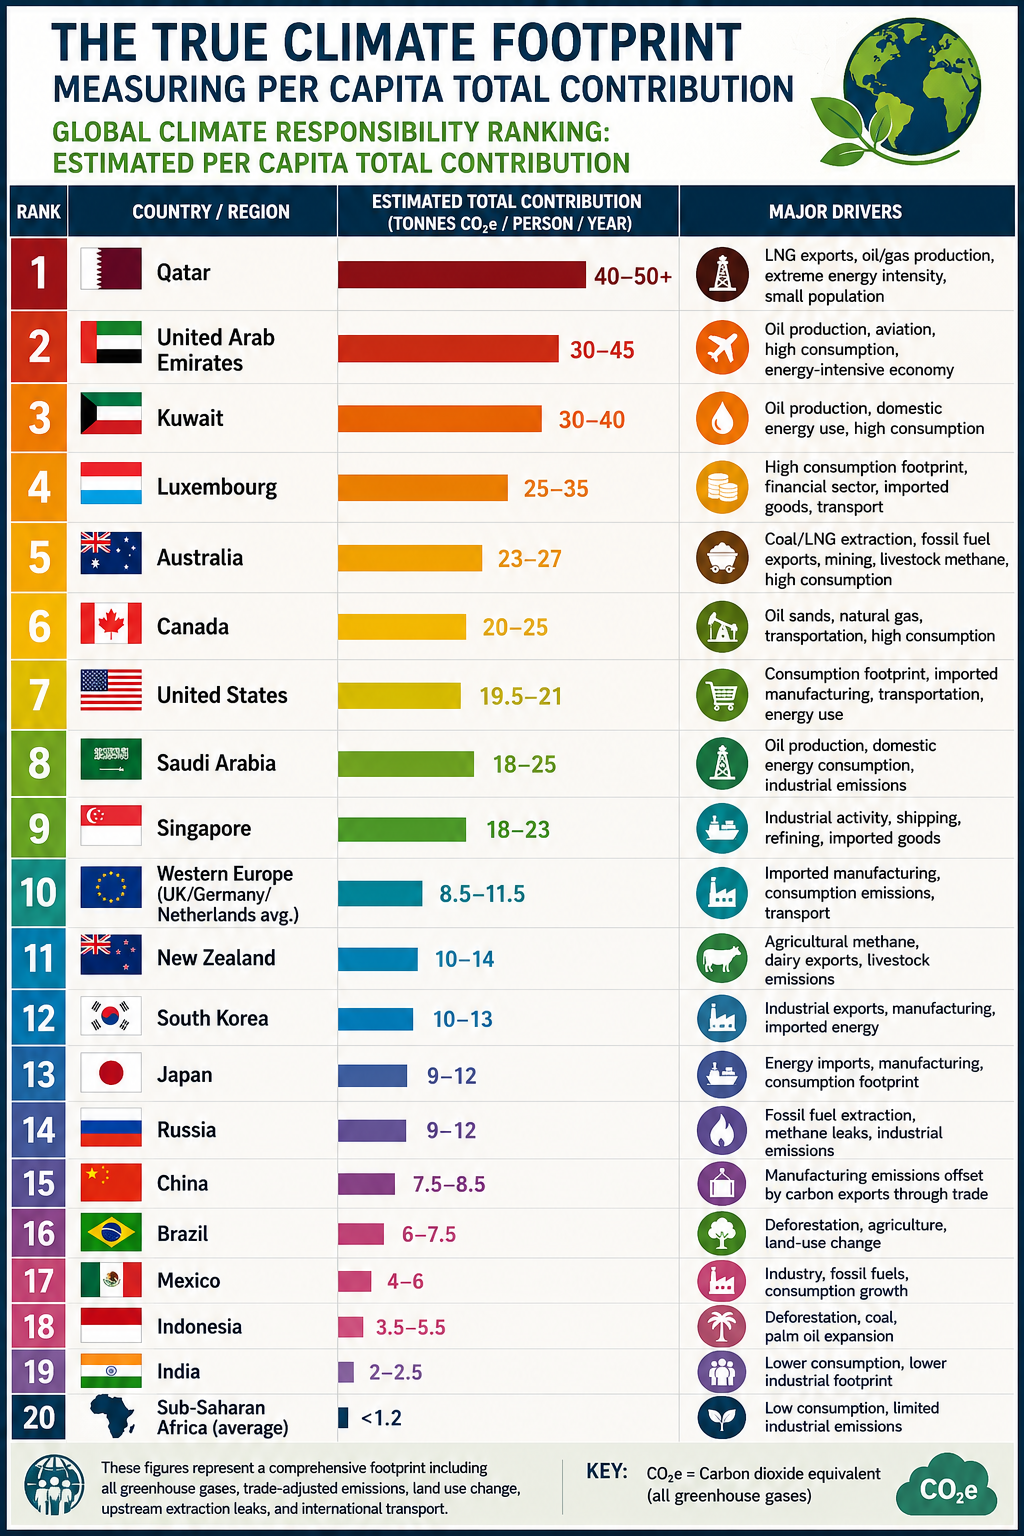
Climate responsibility is often measured using territorial emissions: the greenhouse gases released within a country’s borders. While useful, this approach does not capture the full climate footprint of modern economies because it ignores global supply chains, outsourced manufacturing, land-use change, and upstream fossil fuel emissions.
A more complete measure requires calculating Per Capita Total Contribution—a footprint-based accounting system that assigns responsibility based on the full lifecycle of consumption and environmental impact.
This approach combines:
Using this broader framework, humanity’s total annual climate footprint rises to approximately 53.5 billion tonnes of CO₂-equivalent (CO₂e), or about 6.6 tonnes of CO₂e per person globally.
However, once these factors are included, the global map of climate responsibility changes dramatically.
Traditional accounting assigns emissions to the country where goods are produced. This creates a major distortion in a globalized economy.
Consumption-based accounting reverses this by:
This reveals a significant shift:
Many wealthy nations have reduced domestic industrial emissions partly by moving manufacturing overseas. Electronics, clothing, machinery, and other consumer products may be manufactured in China or Southeast Asia, but much of the demand originates in North America and Europe.
The emissions occur in the producing country, but the consumption benefit occurs elsewhere.
Under territorial accounting:
Under footprint accounting:
Deforestation and land conversion contribute roughly 10% of global greenhouse gas emissions.
However, these emissions are rarely assigned to the ultimate consumers driving demand.
A complete accounting system tracks:
Some nations experience a substantial increase in their climate footprint when imported commodities are included.
Examples:
Burning fossil fuels is only part of their climate impact.
A complete footprint must include emissions from extraction:
Methane is especially important because it is approximately 30 times more powerful than carbon dioxide over a 100-year period.
Territorial accounting can distort responsibility:
A true accounting system assigns these emissions across the entire fossil fuel supply chain, including the countries ultimately consuming the energy.
| Country / Region | Standard Territorial CO₂ (Fossil Fuels Only) | Estimated Total Contribution (All GHGs + Trade + Land Use + Transport) | Primary Driver of Change |
|---|---|---|---|
| United States | ~14.9 tonnes/person | ~19.5–21.0 tonnes/person | High consumption, imported manufacturing, carbon-intensive lifestyles |
| Western Europe | ~4.5–7.0 tonnes/person | ~8.5–11.5 tonnes/person | Outsourced manufacturing and imported goods |
| China | ~8.0 tonnes/person | ~7.5–8.5 tonnes/person | Large manufacturing exporter offsets domestic emissions |
| Brazil | ~2.3 tonnes/person | ~6.0–7.5 tonnes/person | Deforestation and agricultural land conversion |
| India | ~2.0 tonnes/person | ~2.2 tonnes/person | Lower consumption footprint |
| Sub-Saharan Africa | <1.0 tonnes/person | <1.2 tonnes/person | Low consumption and limited industrial emissions |
| Rank | Country / Region | Estimated Total Contribution (Tonnes CO₂e/person/year) | Major Drivers |
|---|---|---|---|
| 1 |
 Qatar
Qatar
|
40–50+ | LNG exports, oil/gas production, extreme energy intensity, small population |
| 2 |
 United Arab Emirates
|
30–45 | Oil production, aviation, high consumption, energy-intensive economy |
| 3 |
 Kuwait
|
30–40 | Oil production, domestic energy use, high consumption |
| 4 |
 Luxembourg
|
25–35 | High consumption footprint, financial sector, imported goods, transport |
| 5 |
 Australia
|
23–27 | Coal/LNG extraction, fossil fuel exports, mining, livestock methane, high consumption |
| 6 |
 Canada
|
20–25 | Oil sands, natural gas, transportation, high consumption |
| 7 |
 United States
|
19.5–21 | Consumption footprint, imported manufacturing, transportation, energy use |
| 8 |
 Saudi Arabia
|
18–25 | Oil production, domestic energy consumption, industrial emissions |
| 9 |
 Singapore
|
18–23 | Industrial activity, shipping, refining, imported goods |
| 10 | 🌍 Western Europe (UK/Germany/Netherlands average) | 8.5–11.5 | Imported manufacturing, consumption emissions, transport |
| 11 |
 New Zealand
|
10–14 | Agricultural methane, dairy exports, livestock emissions |
| 12 |
 South Korea
|
10–13 | Industrial exports, manufacturing, imported energy |
| 13 |
 Japan
Japan
|
9–12 | Energy imports, manufacturing, consumption footprint |
| 14 |
 Russia
|
9–12 | Fossil fuel extraction, methane leaks, industrial emissions |
| 15 |
 China
China
|
7.5–8.5 | Manufacturing emissions offset by carbon exports through trade |
| 16 |
 Brazil
|
6–7.5 | Deforestation, agriculture, land-use change |
| 17 |
 Mexico
|
4–6 | Industry, fossil fuels, consumption growth |
| 18 |
 Indonesia
|
3.5–5.5 | Deforestation, coal, palm oil expansion |
| 19 |
 India
India
|
2–2.5 | Lower consumption, lower industrial footprint |
| 20 | 🌍 Sub-Saharan Africa (average) | <1.2 | Low consumption, limited industrial emissions |
The climate challenge is often framed as a population problem. However, the dominant driver of emissions is not simply the number of people on Earth—it is the per capita intensity of resource consumption and pollution.
A more accurate equation is:Total Climate Impact=Population×Per Capita Consumption×Carbon Intensity
Population matters, but consumption patterns and technology determine the magnitude of environmental impact.
A world with billions more people using efficient, low-carbon systems could have a smaller footprint than a smaller population consuming resources at current high-intensity levels.
Territorial emissions remain useful for tracking national inventories, but they do not fully capture responsibility in a globalized economy.
A true Per Capita Total Contribution framework recognizes that climate change is driven by:
The future of climate accountability depends on moving beyond borders and measuring the complete human footprint on Earth.
The climate conversation has focused on the wrong number.
The problem isn’t simply how many people live on Earth.
It’s how each of us lives.
The average person on the planet is responsible for about 6.6 tonnes of CO₂e per year, but the differences between countries are staggering. Some affluent societies generate 20–50+ tonnes per person, while much of the developing world contributes less than 2 tonnes.
That’s why climate responsibility is better measured by per capita total contribution—including consumption, outsourced manufacturing, deforestation, fossil fuel extraction, agriculture, and transportation—not just emissions produced within national borders.
A child born into a high-consumption lifestyle can have a climate footprint many times larger than several people living in low-consumption economies.
The challenge is not humanity itself.
The challenge is how we consume, how we produce, and how much we extract from the planet.
Changing lifestyles, improving efficiency, and transitioning to cleaner energy can reduce our impact without reducing our humanity.
The future depends less on the number of people—and more on the choices each of us makes.
For decades, climate responsibility has often been measured by where fossil fuels are extracted or where products are manufactured. While useful for tracking national emissions, this production-based approach can misrepresent who ultimately drives demand.
A consumption-based accounting approach shifts the focus to the end user. Instead of assigning emissions to the country where a product is made, it attributes emissions to the people and businesses that ultimately consume the energy, goods, and services.
Under this framework, every kilowatt-hour of electricity, every heating bill, every medical service, and every consumer product is assigned to its final destination.
For example, if a smartphone is manufactured in Asia using electricity generated from coal and then shipped across the Pacific to a consumer in Los Angeles, the emissions associated with mining, manufacturing, transportation, and delivery are attributed to the American consumer—not the manufacturing country.
This approach provides a more accurate picture of the carbon footprint associated with modern lifestyles.
Most consumption analyses rely on Multi-Regional Input-Output (MRIO) economic models, which trace emissions through global supply chains before assigning them to final consumers.
Individual carbon footprints are generally divided into three major categories:
Emissions from energy used directly by households, including:
Emissions generated while producing and transporting purchased products, including:
These emissions often occur in countries far from the final consumer.
Many of the largest emissions in developed economies come not from physical products but from services, including:
In the United States alone, healthcare contributes roughly 1.6 tonnes of CO₂-equivalent emissions per person each year, illustrating how service-based economies can generate substantial carbon footprints even as heavy industry declines.
In wealthy economies such as Singapore, Luxembourg, and several Western European countries, manufacturing represents only a small portion of domestic emissions.
Instead, much of their climate impact comes from:
As economies become increasingly service-oriented, carbon emissions become embedded in complex international supply chains rather than local smokestacks.
Climate strongly influences direct household energy use.
Countries with long, cold winters or extremely hot summers require substantially more energy for climate control.
For example:
Local climate remains an important contributor even after imported goods are included.
China illustrates one of the largest differences between production-based and consumption-based accounting.
Because China manufactures enormous quantities of products for export, its territorial emissions are among the highest in the world.
However, when emissions are allocated to the people who ultimately purchase those products, China’s domestic per-capita consumption footprint is estimated at roughly 6.8 tonnes of CO₂-equivalent per year.
This highlights the distinction between:
Many products manufactured in China are consumed in North America and Europe, meaning a significant share of manufacturing emissions is driven by foreign demand.
Estimated consumption footprint: 14.8 tonnes CO₂e per person
Norway’s electricity is more than 85% hydropower, giving it one of the cleanest electrical grids in the world.
Yet Norwegians have high purchasing power and consume large quantities of imported goods, including:
Norway also has one of the world’s highest rates of air travel per capita, increasing its service-sector emissions.
The result is a consumption footprint considerably larger than its territorial emissions suggest.
Estimated consumption footprint: 11.2 tonnes CO₂e per person
The United Kingdom has significantly reduced domestic production emissions by retiring coal-fired power plants and expanding renewable electricity.
However, much of the country’s manufacturing has shifted overseas.
The UK imports large quantities of:
Consequently, much of its carbon footprint exists outside its borders, while domestic emissions increasingly come from finance, digital infrastructure, commercial services, and transportation.
Estimated consumption footprint: 9.2 tonnes CO₂e per person
France demonstrates how a low-carbon electricity system can substantially reduce consumption emissions.
French households enjoy living standards comparable to neighboring Western European countries, yet much of their residential electricity, rail transportation, and heating is supplied by nuclear energy.
As a result, France’s direct household energy emissions are estimated to be roughly 30% lower than those of many neighboring countries with similar consumption patterns.
When emissions are assigned to consumers rather than producers, an average citizen in countries such as Germany or the United Kingdom is responsible for nearly twice the carbon footprint of the average Chinese citizen.
Although China’s middle class continues to grow and domestic consumption is increasing, much of the country’s industrial output still serves international markets.
This comparison illustrates a key insight of consumption-based accounting:
A nation’s production does not necessarily reflect the climate impact of its residents’ lifestyles.
Consumption-based accounting reframes climate responsibility by asking a simple question:
Who ultimately benefits from the energy and resources consumed?
Rather than focusing solely on where emissions occur, this approach follows products and services through global supply chains to their final users.
For affluent economies that import large volumes of manufactured goods while exporting much of their industrial production, consumption-based accounting often reveals substantially higher per-capita climate footprints than traditional territorial inventories.
Viewed through this lens, lifestyle choices, purchasing power, housing, transportation, travel, healthcare, digital services, and overall consumption patterns become the primary drivers of individual climate responsibility.
Ultimately, the atmosphere responds to total emissions, regardless of where they occur. Consumption-based accounting provides a complementary perspective to traditional production-based inventories by connecting those emissions to the people and economies whose demand created them.
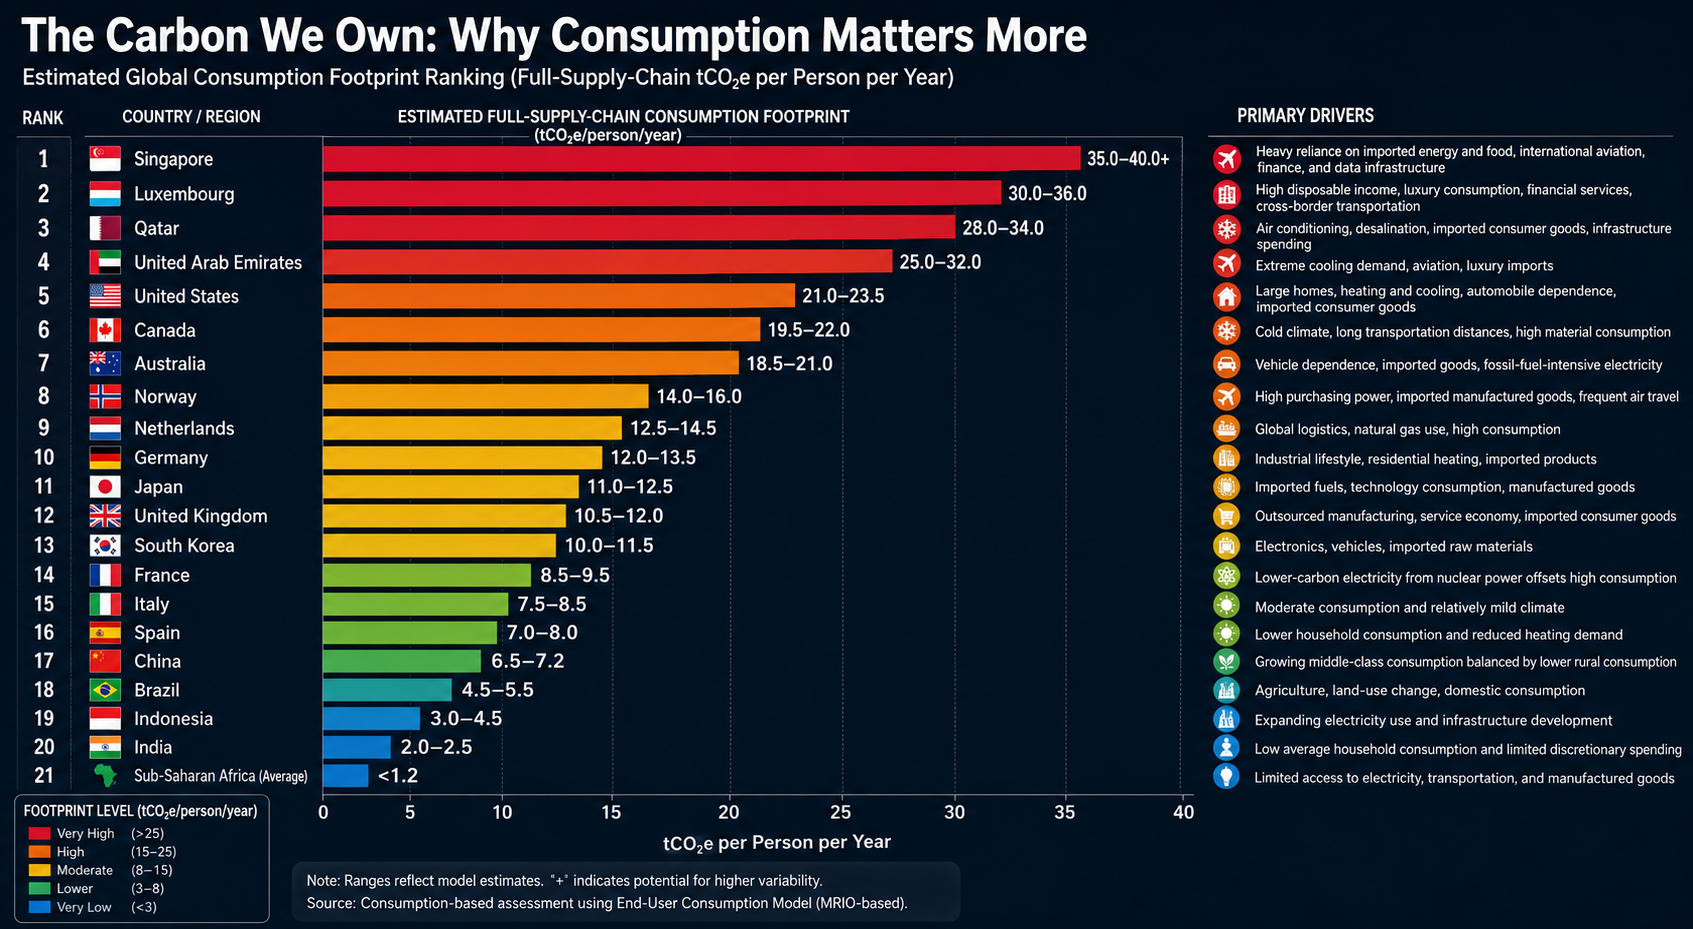
Traditional emissions inventories assign carbon pollution to the country where fossil fuels are extracted or products are manufactured. A consumption-based accounting approach instead assigns those emissions to the people and economies that ultimately consume the goods and services.
The rankings below are based on an End-User Consumption Model, which allocates the full upstream supply-chain emissions—including raw material extraction, manufacturing, international transportation, agricultural land-use change, and other embedded emissions—to the final purchaser.
Rather than measuring where emissions occur, this framework estimates the carbon footprint required to sustain the average lifestyle of a country’s residents. It reflects direct household energy use, consumption of imported goods, transportation, public infrastructure, and carbon-intensive services.
| Rank | Country / Region | Estimated Full-Supply-Chain Consumption Footprint (tCO₂e/person/year) | Primary Drivers |
|---|---|---|---|
| 1 | Singapore |
35.0–40.0+ | Heavy reliance on imported energy and food, international aviation, finance, and data infrastructure |
| 2 | Luxembourg |
30.0–36.0 | High disposable income, luxury consumption, financial services, cross-border transportation |
| 3 | Qatar |
28.0–34.0 | Air conditioning, desalination, imported consumer goods, infrastructure spending |
| 4 | United Arab Emirates |
25.0–32.0 | Extreme cooling demand, aviation, luxury imports |
| 5 | United States |
21.0–23.5 | Large homes, heating and cooling, automobile dependence, imported consumer goods |
| 6 | Canada |
19.5–22.0 | Cold climate, long transportation distances, high material consumption |
| 7 | Australia |
18.5–21.0 | Vehicle dependence, imported goods, fossil-fuel-intensive electricity |
| 8 |  Norway Norway |
14.0–16.0 | High purchasing power, imported manufactured goods, frequent air travel |
| 9 |  Netherlands Netherlands |
12.5–14.5 | Global logistics, natural gas use, high consumption |
| 10 |  Germany Germany |
12.0–13.5 | Industrial lifestyle, residential heating, imported products |
| 11 | Japan |
11.0–12.5 | Imported fuels, technology consumption, manufactured goods |
| 12 |  United Kingdom United Kingdom |
10.5–12.0 | Outsourced manufacturing, service economy, imported consumer goods |
| 13 | South Korea |
10.0–11.5 | Electronics, vehicles, imported raw materials |
| 14 |  France France |
8.5–9.5 | Lower-carbon electricity from nuclear power offsets high consumption |
| 15 |  Italy Italy |
7.5–8.5 | Moderate consumption and relatively mild climate |
| 16 |  Spain Spain |
7.0–8.0 | Lower household consumption and reduced heating demand |
| 17 | China |
6.5–7.2 | Growing middle-class consumption balanced by lower rural consumption |
| 18 | Brazil |
4.5–5.5 | Agriculture, land-use change, domestic consumption |
| 19 | Indonesia |
3.0–4.5 | Expanding electricity use and infrastructure development |
| 20 | India |
2.0–2.5 | Low average household consumption and limited discretionary spending |
| 21 | 🌍 Sub-Saharan Africa (Average) | <1.2 | Limited access to electricity, transportation, and manufactured goods |
Singapore and Luxembourg rank highest despite having relatively little domestic heavy industry. Their residents consume large quantities of imported goods and services, while extensive international transportation, finance, aviation, and digital infrastructure contribute substantial embedded emissions.
The United States, Canada, and Australia consistently rank among the world’s largest per-capita consumers. Large homes, automobile-dependent communities, extensive heating or cooling needs, and high levels of discretionary consumption combine to produce substantial lifestyle-related emissions.
Countries such as France and Norway demonstrate that cleaner electricity significantly lowers household energy emissions. However, imported goods, international travel, and service-sector activities remain important contributors to their overall consumption footprints.
China’s production-based emissions are among the highest globally because it manufactures goods for international markets. Under a consumption-based framework, however, the average Chinese citizen’s lifestyle footprint remains considerably lower than that of residents in many affluent Western countries.
Perhaps the clearest finding is the enormous gap between affluent economies and developing regions. Average per-capita consumption in Sub-Saharan Africa remains a small fraction of that in the world’s wealthiest nations, reflecting differences in income, energy access, transportation, housing, and consumer purchasing power.
This comparison underscores a central conclusion of consumption-based accounting: the carbon footprint of an individual is driven primarily by the scale and complexity of the lifestyle they support, rather than the geographic location where the associated emissions physically occur.
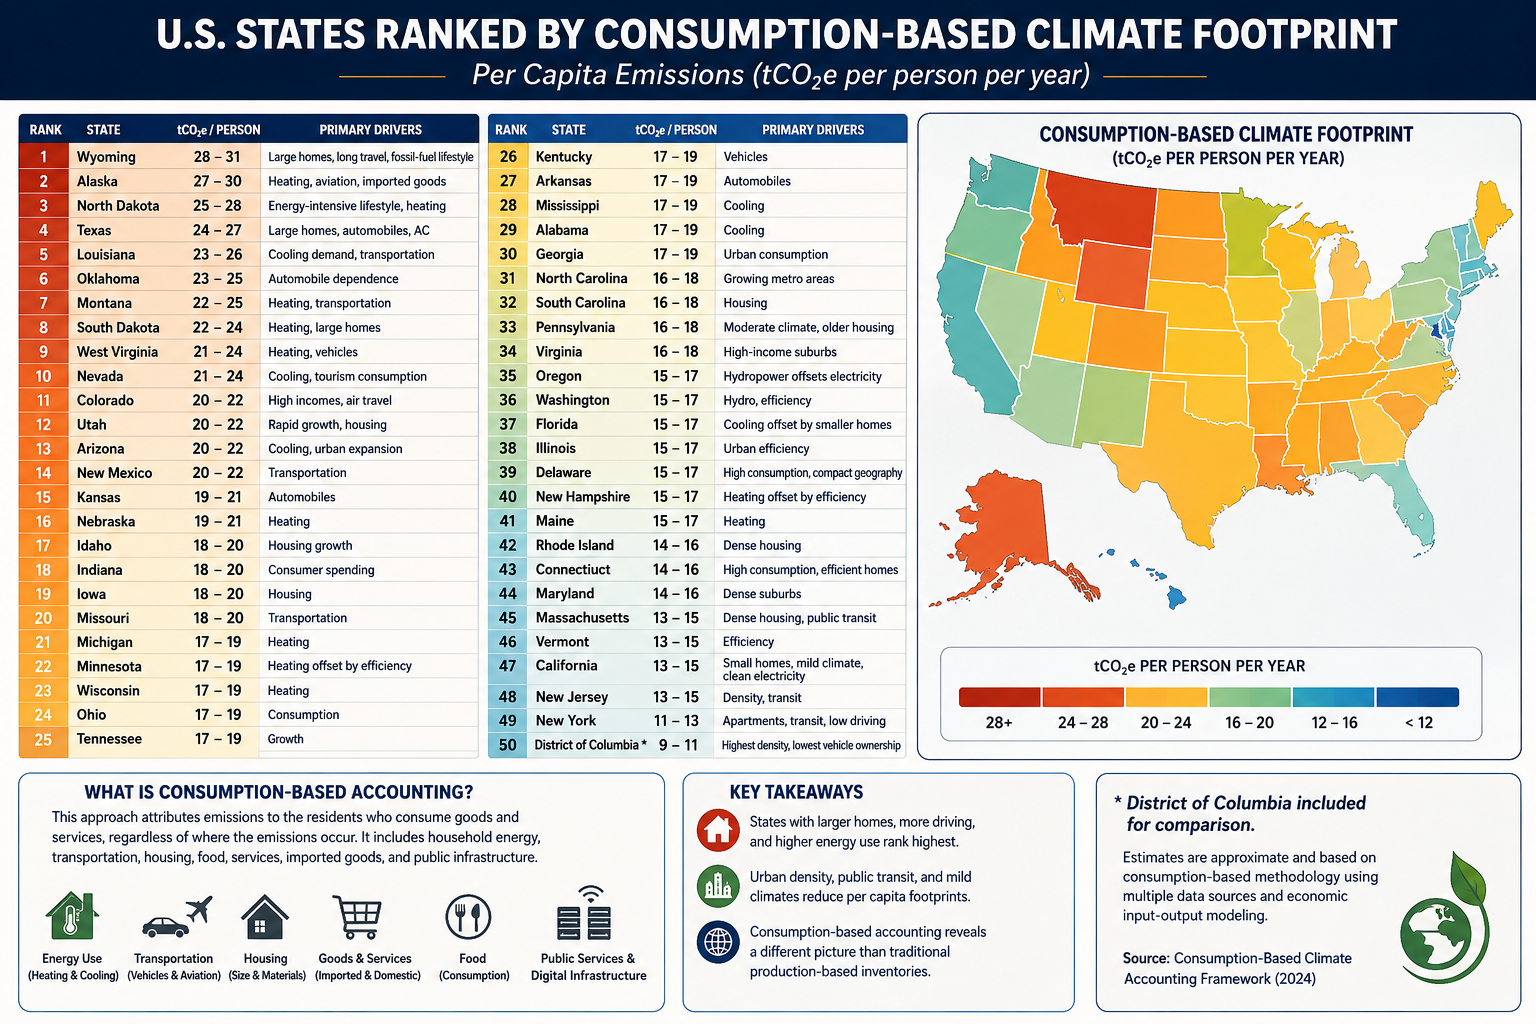
These states combine several characteristics:
Texas, Alaska, Wyoming, and North Dakota score highly not simply because of fossil-fuel production, but because residents tend to consume more energy per person.
The Northeast and California benefit from:
New York illustrates the effect well. Although it has one of the largest economies in the world, the average resident lives in a much smaller dwelling, drives less, and relies more on mass transit than residents of most other states, resulting in one of the lowest per-capita consumption footprints.
(tCO₂e per person per year)
| Rank | State | Estimated Footprint | Primary Drivers |
|---|---|---|---|
| 1 | Wyoming | 28–31 | Large homes, long travel distances, fossil-fuel lifestyle |
| 2 | Alaska | 27–30 | Heating, aviation, imported goods |
| 3 | North Dakota | 25–28 | Energy-intensive lifestyle, heating |
| 4 | Texas | 24–27 | Large homes, automobiles, air conditioning |
| 5 | Louisiana | 23–26 | Cooling demand, transportation |
| 6 | Oklahoma | 23–25 | Automobile dependence |
| 7 | Montana | 22–25 | Heating, transportation |
| 8 | South Dakota | 22–24 | Heating, large homes |
| 9 | West Virginia | 21–24 | Heating, vehicles |
| 10 | Nevada | 21–24 | Cooling, tourism consumption |
| 11 | Colorado | 20–22 | High incomes, air travel |
| 12 | Utah | 20–22 | Rapid growth, housing |
| 13 | Arizona | 20–22 | Cooling, urban expansion |
| 14 | New Mexico | 20–22 | Transportation |
| 15 | Kansas | 19–21 | Automobiles |
| 16 | Nebraska | 19–21 | Heating |
| 17 | Idaho | 18–20 | Housing growth |
| 18 | Indiana | 18–20 | Consumer spending |
| 19 | Iowa | 18–20 | Housing |
| 20 | Missouri | 18–20 | Transportation |
| 21 | Michigan | 17–19 | Heating |
| 22 | Minnesota | 17–19 | Heating offset by efficiency |
| 23 | Wisconsin | 17–19 | Heating |
| 24 | Ohio | 17–19 | Consumption |
| 25 | Tennessee | 17–19 | Growth |
| 26 | Kentucky | 17–19 | Vehicles |
| 27 | Arkansas | 17–19 | Automobiles |
| 28 | Mississippi | 17–19 | Cooling |
| 29 | Alabama | 17–19 | Cooling |
| 30 | Georgia | 17–19 | Urban consumption |
| 31 | North Carolina | 16–18 | Growing metro areas |
| 32 | South Carolina | 16–18 | Housing |
| 33 | Pennsylvania | 16–18 | Moderate climate, older housing |
| 34 | Virginia | 16–18 | High-income suburbs |
| 35 | Oregon | 15–17 | Hydropower offsets electricity |
| 36 | Washington | 15–17 | Hydro, efficiency |
| 37 | Florida | 15–17 | Cooling offset by small homes |
| 38 | Illinois | 15–17 | Urban efficiency |
| 39 | Delaware | 15–17 | High consumption, compact geography |
| 40 | New Hampshire | 15–17 | Heating offset by efficiency |
| 41 | Maine | 15–17 | Heating |
| 42 | Rhode Island | 14–16 | Dense housing |
| 43 | Connecticut | 14–16 | High consumption, efficient homes |
| 44 | Maryland | 14–16 | Dense suburbs |
| 45 | Massachusetts | 13–15 | Dense housing, public transit |
| 46 | Vermont | 13–15 | Efficiency |
| 47 | California | 13–15 | Small homes, mild climate, clean electricity |
| 48 | New Jersey | 13–15 | Density, transit |
| 49 | New York | 11–13 | Apartments, transit, low driving |
| 50 | District of Columbia* | 9–11 | Highest density, lowest vehicle ownership |
(*Included for comparison.)
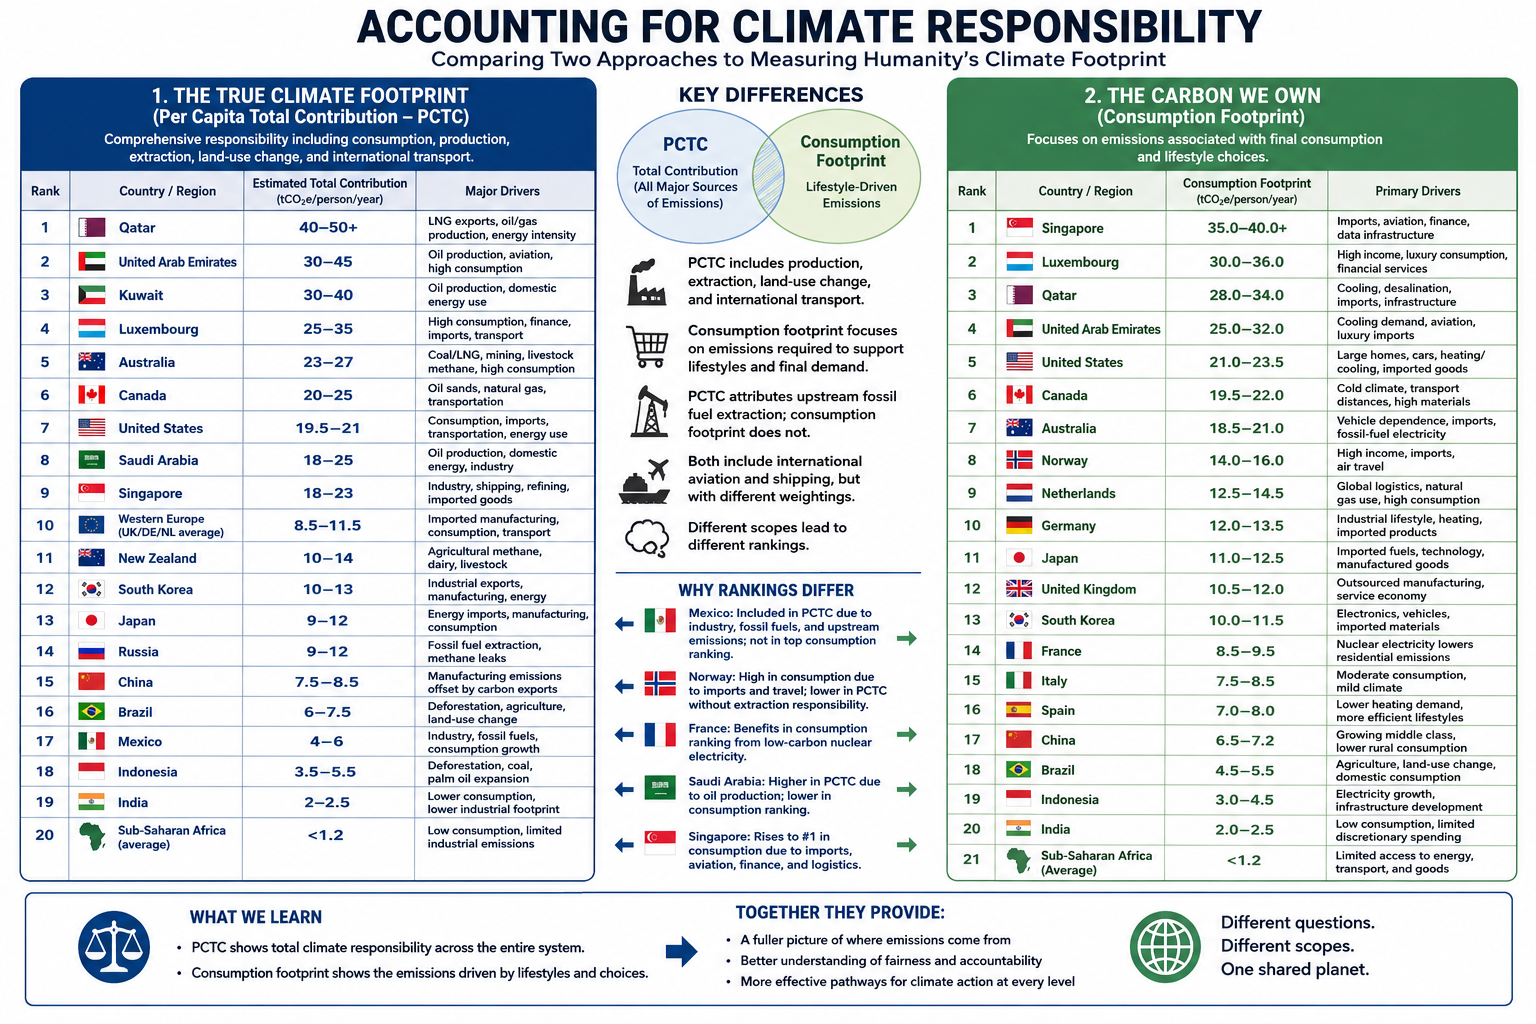
Although The True Climate Footprint and The Carbon We Own both seek to improve upon traditional territorial emissions accounting, they answer different questions because they are built on different accounting frameworks.
The True Climate Footprint uses the Per Capita Total Contribution (PCTC) framework to estimate an individual’s or nation’s complete contribution to climate change. It extends beyond consumption to include land-use change, upstream fossil fuel extraction, international shipping and aviation, and the full spectrum of greenhouse gases. In some cases, it also attributes responsibility associated with fossil-fuel production, providing a broad measure of humanity’s total climate impact.
By contrast, The Carbon We Own focuses specifically on consumption-based climate responsibility. Using Multi-Regional Input-Output (MRIO) accounting, it assigns emissions to the final consumer by emphasizing direct household energy use, embedded emissions in imported goods, services, and lifestyle choices. It intentionally deemphasizes extraction and producer responsibility in order to better represent the carbon footprint required to sustain modern patterns of consumption.
Because these frameworks measure different aspects of climate responsibility, their rankings are not expected to be identical.
Mexico provides a useful illustration. Under the PCTC framework, Mexico’s estimated footprint includes domestic industry, fossil fuel production, growing consumption, and upstream emissions, resulting in an estimated contribution of approximately 4–6 tonnes of CO₂-equivalent per person per year. In the consumption-based analysis, however, Mexico does not appear among the highest-ranking countries because the focus is limited to end-user consumption, and the published rankings emphasize the world’s largest per-capita consumption footprints.
Similar differences appear elsewhere. Norway’s position changes substantially because one framework incorporates the climate responsibility associated with fossil fuel production, while the other emphasizes domestic consumption. France benefits in the consumption-based analysis because its low-carbon nuclear electricity reduces household emissions despite maintaining a high standard of living. Saudi Arabia ranks differently depending on whether responsibility is assigned to oil production or to energy consumption. Singapore rises dramatically under consumption accounting because imported goods, international aviation, finance, logistics, and digital infrastructure contribute heavily to its consumption footprint despite relatively limited domestic manufacturing.
These examples demonstrate that accounting methodology influences how climate responsibility is distributed. Production-based, consumption-based, and total-contribution frameworks each illuminate different dimensions of the global climate system.
Rather than viewing these approaches as competing methodologies, they should be regarded as complementary analytical tools. The Per Capita Total Contribution (PCTC) framework asks, What is a nation’s or individual’s total contribution to climate change? The consumption-based framework asks, What emissions are required to sustain the average resident’s lifestyle? Together, they provide a more complete understanding of climate responsibility than either approach can achieve alone, revealing both the systemic impacts of resource production and the powerful role of consumer demand in shaping the global climate.
When most people think about greenhouse gas emissions, they picture sprawling cities, crowded highways, and millions of people flipping on lights and air conditioners. It’s no surprise, then, that states like California, Texas, Florida, and New York usually dominate lists of greenhouse gas emissions. But those rankings tell only part of the story.
What if the question isn’t simply “Which states emit the most greenhouse gases?” What if it’s “Which states are most responsible for producing the fossil fuels that drive climate change?”
The answer looks dramatically different.
Traditional greenhouse gas inventories are based on territorial emissions—the emissions that physically occur within a state’s borders. That includes electricity generation, transportation, manufacturing, agriculture, and buildings.
This accounting system is useful, but it overlooks much of the climate impact associated with fossil fuel production.
Before a gallon of gasoline reaches your car or natural gas heats your home, fossil fuels must be:
Each of these steps releases greenhouse gases. Oil wells leak methane. Coal mines vent methane. Natural gas fields flare excess gas. Refineries consume enormous amounts of energy. LNG export terminals require massive refrigeration systems. Petrochemical plants emit carbon dioxide while transforming hydrocarbons into fuels and plastics.
These emissions are real. Yet many are only partially reflected—or entirely absent—from conventional state comparisons.
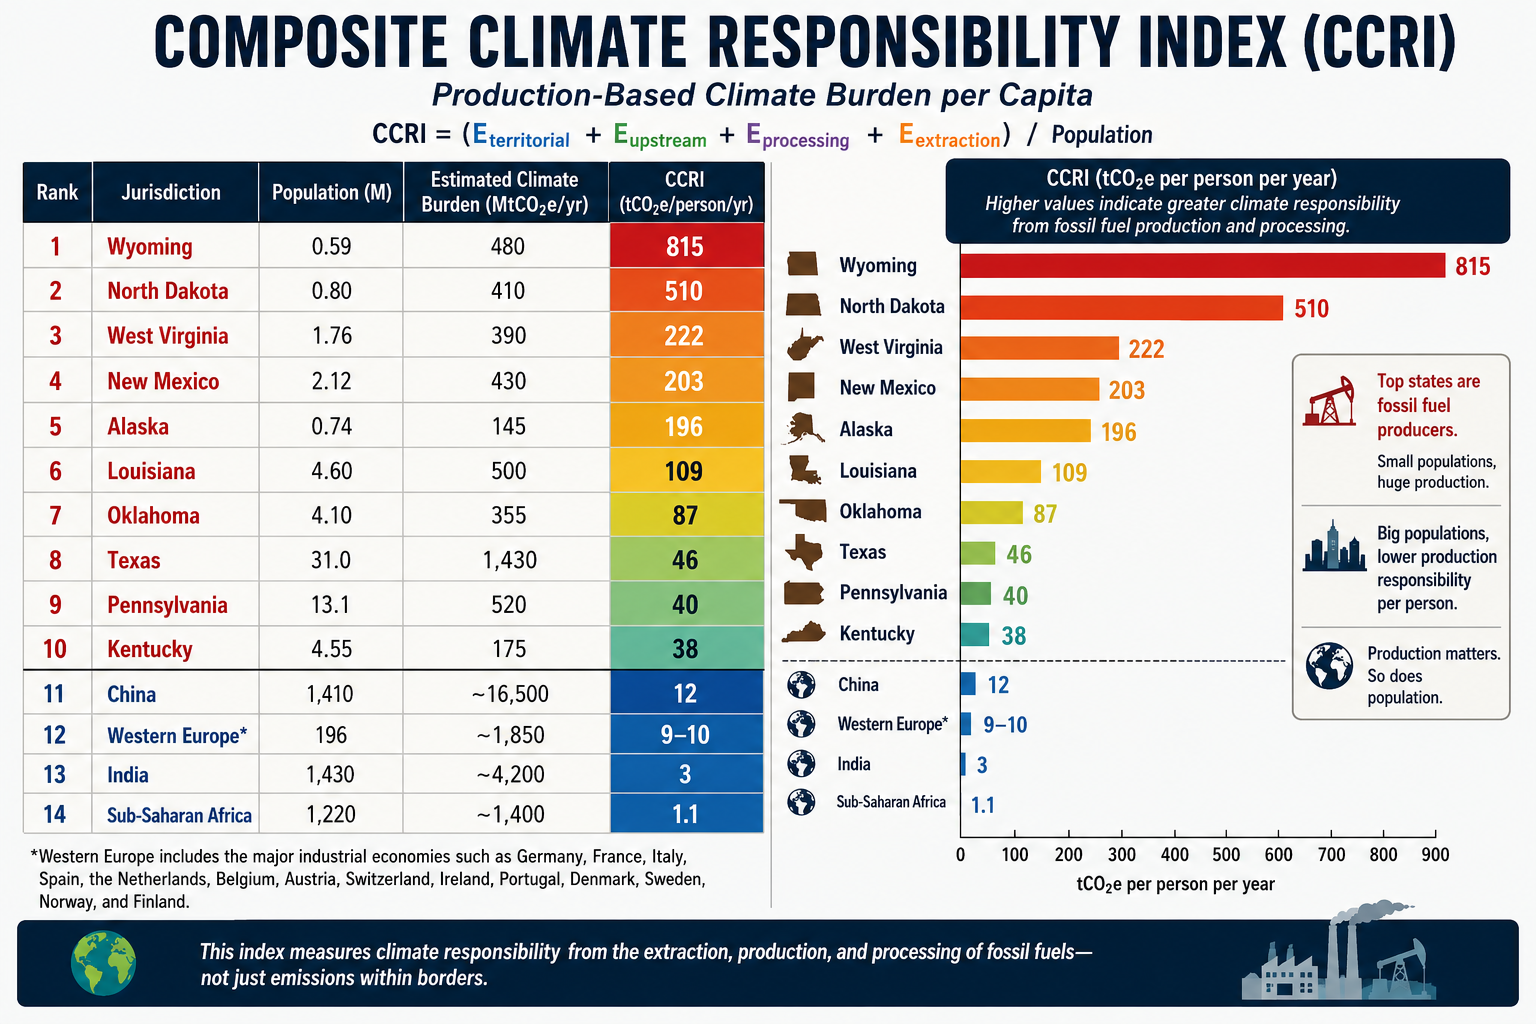
To capture the full climate burden of fossil fuel production, I developed the Composite Climate Responsibility Index (CCRI).
Rather than looking only at emissions released within a state’s borders, CCRI combines four major components:
The combined total is then divided by the state’s population to produce a per-capita measure of climate responsibility.
This approach shifts the focus from where emissions occur to where the fossil fuel system originates.
Applying this framework produces a ranking that bears little resemblance to traditional greenhouse gas inventories.
Instead of being dominated by the largest population centers, the states with the highest per-capita climate responsibility are overwhelmingly those that produce fossil fuels.
Notice who’s missing.
California, Florida, New York, New Jersey, Massachusetts, and Washington—all states commonly associated with high emissions because of their large populations—drop dramatically in the rankings.
Instead, relatively small states become climate heavyweights because they extract, refine, process, or export enormous quantities of fossil fuels.
Wyoming is home to fewer than 600,000 residents, yet it produces more coal than any other state and remains a major producer of natural gas.
Under conventional accounting, Wyoming appears to have modest total emissions simply because so few people live there.
But when coal mining, methane releases, and extraction activities are included, Wyoming’s per-capita climate burden becomes extraordinary.
Its climate footprint is measured not by how many people live there, but by how much carbon leaves the state embedded in coal, oil, and natural gas.
Texas remains in a category of its own.
No other state combines:
Its enormous population moderates its per-capita ranking, but Texas still lands in the top ten because the scale of its fossil fuel industry is unmatched.
In absolute terms, Texas likely contributes more lifecycle greenhouse gas emissions than any other U.S. state.
One of the largest differences between CCRI and conventional inventories is methane.
Natural gas has often been marketed as a “cleaner” fossil fuel because it emits less carbon dioxide when burned than coal.
However, methane itself is a potent greenhouse gas. Even relatively small leaks during drilling, gathering, processing, and transportation can substantially increase the climate impact of natural gas production.
States with large oil and gas industries—such as New Mexico, North Dakota, Pennsylvania, Oklahoma, and Louisiana—move sharply upward once methane leakage, venting, and flaring are included.
Ignoring upstream methane is like calculating the cost of owning a car while pretending gasoline is free.
The key insight of CCRI is that climate responsibility does not end where emissions occur.
A barrel of oil extracted in North Dakota may be refined in Louisiana, transported through Texas, shipped overseas, and ultimately burned in Europe or Asia.
Each step adds greenhouse gases.
Traditional inventories divide these emissions among multiple jurisdictions, often obscuring the role of the states that initiated the fossil fuel supply chain.
CCRI reconnects those pieces.
It recognizes that extraction, processing, and upstream emissions are not incidental—they are essential components of fossil fuel production.
The Composite Climate Responsibility Index is not intended to replace traditional greenhouse gas inventories. Those inventories remain indispensable for tracking progress toward emissions reduction within individual states.
Instead, CCRI complements existing accounting by expanding the system boundary to include the activities that make fossil fuel consumption possible.
This broader perspective helps answer questions that territorial inventories cannot:
By incorporating extraction, processing, upstream methane, and direct emissions into a single per-capita metric, CCRI reveals a reality that traditional rankings often miss: the states producing the fuels that power the global economy are frequently those carrying the largest climate responsibility—even when their populations are relatively small.
In the coming years, as policymakers increasingly focus on lifecycle emissions, methane mitigation, and supply-side climate policy, production-based metrics such as CCRI may prove to be as important as the territorial inventories that have guided climate reporting for decades.
A comparison becomes especially revealing when the same production-based accounting is applied to both U.S. states and world regions. Instead of asking who burns the carbon, the CCRI asks who produces and enables the fossil carbon economy.
The formula remains:CCRI=PEterritorial+Eupstream+Eprocessing+Eextraction
Using this methodology, the comparison changes dramatically from conventional per-capita emissions rankings.
| Rank | Jurisdiction | Population (M) | Estimated Climate Burden (MtCO₂e/yr) | CCRI (tCO₂e/person/yr) |
|---|---|---|---|---|
| 1 | Wyoming | 0.59 | 480 | 815 |
| 2 | North Dakota | 0.80 | 410 | 510 |
| 3 | West Virginia | 1.76 | 390 | 222 |
| 4 | New Mexico | 2.12 | 430 | 203 |
| 5 | Alaska | 0.74 | 145 | 196 |
| 6 | Louisiana | 4.60 | 500 | 109 |
| 7 | Oklahoma | 4.10 | 355 | 87 |
| 8 | Texas | 31.0 | 1,430 | 46 |
| 9 | Pennsylvania | 13.1 | 520 | 40 |
| 10 | Kentucky | 4.55 | 175 | 38 |
| 11 | China | 1,410 | ~16,500 | ≈12 |
| 12 | Western Europe* | 196 | ~1,850 | ≈9–10 |
| 13 | India | 1,430 | ~4,200 | ≈3 |
| 14 | Sub-Saharan Africa | 1,220 | ~1,400 | ≈1.1 |
*Western Europe includes the major industrial economies such as Germany, France, Italy, Spain, the Netherlands, Belgium, Austria, Switzerland, Ireland, Portugal, Denmark, Sweden, Norway, and Finland.
Composite Climate Responsibility Index (CCRI)
Estimated production-based climate burden per capita using territorial emissions, extraction, processing, and upstream emissions.
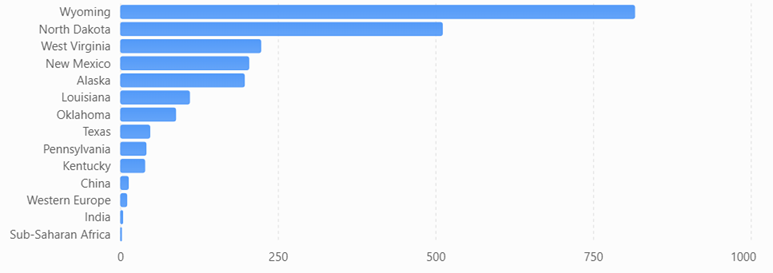
Several important conclusions emerge.
First, fossil fuel production is far more geographically concentrated than fossil fuel consumption. Wyoming’s estimated production-based climate burden is roughly 68 times higher per resident than China’s, despite China’s position as the world’s largest emitter under conventional territorial accounting. The difference reflects Wyoming’s role as a major coal and natural gas producer serving markets far beyond its borders.
Second, China’s ranking changes substantially under the CCRI framework. China remains a major contributor because of its large coal industry, extensive refining capacity, and industrial base, but its enormous population reduces its per-capita production burden to around 12 tCO₂e per person, well below several U.S. fossil-fuel-producing states.
Third, Western Europe falls even lower. While it retains significant refining and industrial capacity, domestic fossil fuel extraction has declined over several decades. Much of its energy is imported, so a production-based metric attributes a smaller share of upstream responsibility than a consumption-based metric would.
Fourth, India and Sub-Saharan Africa rank near the bottom. Although both regions have growing energy demand, their per-capita fossil fuel production and associated upstream emissions remain comparatively low. Their climate burden is driven primarily by domestic energy use rather than large-scale extraction and export industries.
Traditional greenhouse gas inventories emphasize where emissions occur. The CCRI instead emphasizes where the fossil fuel supply chain begins. These are complementary perspectives, each useful for different policy questions.
Together, these three accounting systems provide a more complete understanding of climate responsibility. The comparison also illustrates that some of the world’s highest production-based climate burdens are found not in entire countries, but in a handful of resource-rich U.S. states whose fossil fuel industries serve national and international markets.
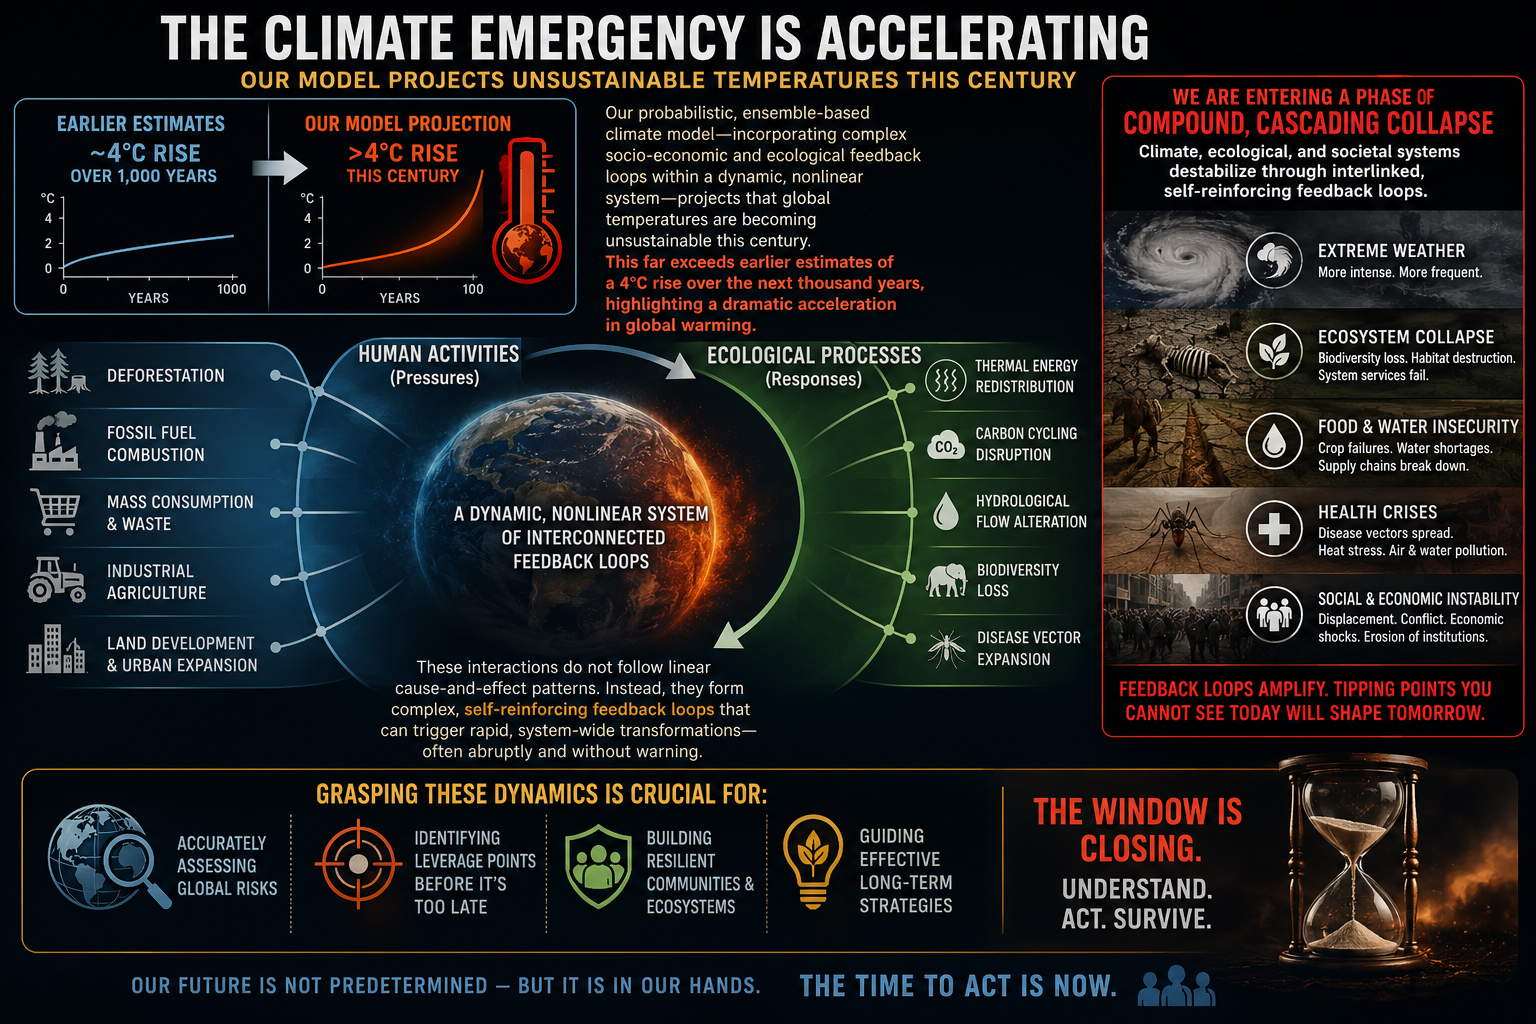
* Our probabilistic, ensemble-based climate model — which incorporates complex socio-economic and ecological feedback loops within a dynamic, nonlinear system — projects that global temperatures are becoming unsustainable this century. This far exceeds earlier estimates of a 4°C rise over the next thousand years, highlighting a dramatic acceleration in global warming. We are now entering a phase of compound, cascading collapse, where climate, ecological, and societal systems destabilize through interlinked, self-reinforcing feedback loops.
We examine how human activities — such as deforestation, fossil fuel combustion, mass consumption, industrial agriculture, and land development — interact with ecological processes like thermal energy redistribution, carbon cycling, hydrological flow, biodiversity loss, and the spread of disease vectors. These interactions do not follow linear cause-and-effect patterns. Instead, they form complex, self-reinforcing feedback loops that can trigger rapid, system-wide transformations — often abruptly and without warning. Grasping these dynamics is crucial for accurately assessing global risks and developing effective strategies for long-term survival.
Bottom line: The question is no longer how warm the planet becomes, but how life on Earth can endure when change outpaces our ability to adapt.
We cannot control the laws of physics, but we can control our pollution. The most effective action is to stop burning fossil fuels.